Benchmarks
Composite metrics: 0.6.0 release evidence
The 0.6.0 runner is separate from the 0.4.4/0.5.0 evidence below. It imports checkout source and records its SHA-256 alongside version, commit, and environment. The release study was run before the final version-only bump; the source fingerprints and commits identify exactly what was measured.
python benchmarks/bench_composite_metrics.py --profile quick \
  --output-dir benchmark_runs/v0.6.0-composite-quick
python benchmarks/bench_composite_metrics.py --profile validation \
  --output-dir benchmark_runs/v0.6.0-composite-validation
quick uses 2 trials and 99 resamples per cell; validation uses 30 trials and
499 resamples. Both are preliminary checks, not release coverage evidence.
Eleven scenarios cover independent/paired/clustered ratios, heavy skew,
denominator changes, sparse orders, a larger-cluster comparison, and dependent
activity/price cases at both small and larger cluster counts. References
resample entire rows or clusters, never columns separately. Delta-method
intervals are another approximation, not a ground-truth coverage guarantee.
Dependent activity and price: known truth
The new activity_price, activity_price_covariance,
cluster_activity_price, and cluster_activity_price_large scenarios share a
latent standard-normal variable Z. Conditional order count is Poisson with mean
rate * exp(b * Z - b² / 2); price is exp(m + c * Z + s * epsilon), where
epsilon is an independent standard normal. Revenue is order count times price.
Thus the population ratio is:
E[revenue] / E[orders] = exp(m + b*c + (c² + s²)/2)
It is not simply mean price. In the covariance-change scenario, both arms have the same marginal price distribution and mean order rate, but the activity-price relationship changes the order-weighted metric. The cluster case shares latent activity/price within clusters; cluster size is independent of these variables, so the same known-truth formula applies. Tests check the formula against large generated populations; this does not establish interval coverage. These models do not represent informative cluster sizes.
python benchmarks/bench_composite_metrics.py --profile validation \
  --scenario activity_price --scenario activity_price_covariance \
  --scenario cluster_activity_price --scenario cluster_activity_price_large \
  --output-dir benchmark_runs/v0.6.0-activity-price-validation
Completed candidate evidence and the resulting correction
The first release-profile run completed all 70 cells then present: 300
independently generated datasets per cell and 4,999 resamples, on macOS arm64
with Python 3.11.5, NumPy 2.2.6, and SciPy 1.17.1. It is pinned to commit
e6d11c2 and source SHA-256
260c05d1f269097bd5e089e6b070745210d8b0bf9512a20b980aa2dcc56d94d8.
The current runner adds the previously missing larger correlated-cluster cell,
so that completed run is evidence for the measured source, not the final 77-cell
release gate.
Empirical coverage for bootstrapx's nominal 95% intervals was:
| Scenario | Percentile | Basic | BCa |
|---|---|---|---|
| Independent ratio | 93.3% | 93.7% | 92.0% |
| Paired ratio | 93.7% | 95.0% | 93.0% |
| Cluster ratio (24/30 clusters) | 92.0% | 91.0% | 90.7% |
| Heavy skew | 94.3% | 96.3% | 88.3% |
| Denominator change | 95.7% | 95.3% | 95.3% |
| Cluster ratio (100/120 clusters) | 94.3% | 95.7% | 94.3% |
| Dependent activity/price | 91.7% | 93.7% | 90.0% |
| Activity/price covariance change | 94.0% | 95.0% | 90.0% |
| Clustered activity/price (24/30 clusters) | 93.7% | 92.3% | 87.0% |
SciPy's scalar reference was within one percentage point in every matching non-sparse cell and produced nearly identical widths. This makes an implementation discrepancy unlikely, but does not make the intervals well-calibrated. For BCa in the heavy-skew and two dependent IID scenarios, the upper Wilson bound was below 95%; for clustered activity/price it was 90.3%. The practical example no longer presents BCa as the automatic ratio choice.
All non-sparse cells produced 300 valid intervals and no execution failures. The deliberately sparse scenario produced no valid bootstrap interval because the observed or resampled order denominator was zero; bootstrapx and SciPy both failed explicitly instead of silently dropping draws. This is expected safety behavior, not 0% evidence for a defined interval procedure.
The supplemental release-profile run for the added 100/120-cluster correlated
case completed 7/7 cells at commit f6e2d9c and source SHA-256
2be19c420defa3a1968b660876271643d74b6d97509cb0c07e31562f1e748645.
All 300 trials per method were valid with no failures:
| Library | Percentile | Basic | BCa | Delta normal |
|---|---|---|---|---|
| bootstrapx | 94.7% | 95.0% | 93.0% | — |
| SciPy | 94.3% | 94.7% | 92.7% | — |
| analytic delta reference | — | — | — | 95.0% |
The Wilson intervals include 95% for every method, so 300 trials do not prove the small remaining BCa shortfall is systematic. The important applied result is that the severe 24/30-cluster undercoverage did not persist at 100/120 clusters. This supports a finite-sample warning, not a universal cluster-count threshold. Together the original run and the source-matched supplemental run cover all 77 cells in the current study; provenance remains separate rather than pretending they were one execution.
Interpretation and release runs
Release-profile small-cluster results demonstrate undercoverage. Agreement with
SciPy does not resolve that finite-sample statistical issue. Both large-cluster
scenarios are near nominal, including correlated numerator and denominator
components. Use repeatable --scenario cluster --scenario
cluster_large --scenario cluster_activity_price
--scenario cluster_activity_price_large to focus a run; that selection is part
of the resume contract.
results.csv reports failures, invalid intervals, coverage across all
trials, conditional coverage among valid trials, and Wilson bounds for the
all-trial proportion. Sparse scenarios intentionally expose undefined sample
denominators; completing the runner does not imply every cell succeeded.
runtime.csv separately measures warm-up, median repeated execution and
tracemalloc allocations, including scalar/bounded-vectorized SciPy for
independent metrics and scalar cluster-index references for clustered metrics.
Allocation peaks are not process RSS.
Long runs require a clean worktree, including untracked source/tests. Commit the candidate locally first; pushing is not required. Release profile uses 300 trials/cell and 4,999 resamples; statistical profile uses 1,000 trials/cell.
python benchmarks/bench_composite_metrics.py --profile release \
  --output-dir benchmark_runs/v0.6.0-composite-release
# Resume only with the same source, commit, environment and profile:
python benchmarks/bench_composite_metrics.py --profile release \
  --output-dir benchmark_runs/v0.6.0-composite-release --resume
Coverage checkpoints per cell; an interrupted cell restarts. Progress prints
per cell and every 10 trials in longer profiles. Timing is rerun on resume.
Changed source/environment/configuration is rejected. Outputs remain under
ignored benchmark_runs/, not in the installed library payload.
Benchmarks answer three different questions and should not be mixed:
- Runtime: how long one configured call takes on one machine.
- Working memory: how much memory that call allocates under a stated tool.
- Statistical behavior: how often an interval covers a known parameter across independently generated datasets.
A speed benchmark cannot establish statistical correctness, and increasing
n_resamples reduces Monte Carlo noise but does not repair systematic
undercoverage caused by an unsuitable method.
The product A/B reference and real-world A/B case study serve a fourth purpose: showing end-to-end practitioner workflows. The first has a known synthetic effect; the second has an unknown real population effect. Neither replaces the larger, versioned coverage study below.
0.5.0 experiment-comparison evidence
The 0.5.0 suite is separate from the audited 0.4.4 one-sample results. It checks independent, paired, and clustered comparisons; difference and relative-lift effects; normal, lognormal, exponential, and Bernoulli data; and percentile, basic, and BCa intervals. Applicable independent/paired cells are matched with SciPy. Cluster cells have no SciPy row because SciPy does not provide a cluster-ID experiment interface.
Run the pipeline smoke test:
python benchmarks/run_comparison_release.py \
  --profile quick \
  --output-dir benchmark_runs/v0.5.0-quick
The quick profile uses only two datasets per selected coverage cell and is not statistical evidence. To reproduce the 0.5.0 release study, run the checkpointed release profile from the corresponding clean release checkout:
python benchmarks/run_comparison_release.py \
  --profile release \
  --output-dir benchmark_runs/v0.5.0-release
Resume the identical commit, environment, and configuration after an interruption:
python benchmarks/run_comparison_release.py \
  --profile release \
  --output-dir benchmark_runs/v0.5.0-release \
  --resume
The release profile uses 300 datasets and 4,999 resamples per cell. The
optional --profile statistical uses 1,000 datasets per cell and can take
several times longer. Both profiles record empirical coverage, Wilson bounds,
invalid/failing trials, random-stream policy, versions, commit, platform, and
elapsed time.
Runtime and tracemalloc results are produced by
benchmarks/bench_two_sample.py. New runs report scalar SciPy with its
default batch plus a vectorized SciPy variant using the same bounded batch
heuristic as bootstrapx, and track clustered runtime separately.
After that review, generate the documentation figures from the recorded CSV files rather than copying numbers by hand:
python benchmarks/plot_comparison_results.py \
  --input-dir benchmark_runs/v0.5.0-release \
  --output-dir docs/assets/benchmarks/v0.5.0
Audited 0.5.0 statistical behavior
The versioned release run measured commit c14fe63 on Apple Silicon/macOS
15.7.4 with Python 3.11.5, NumPy 1.26.4, and SciPy 1.11.1. It completed all 33
planned cells: 300 independently generated datasets and 4,999 resamples per
cell, for 9,900 valid intervals in total. No trial failed or produced an
invalid interval.
For the 15 independent and paired cells with a direct SciPy counterpart:
| Method | bootstrapx mean coverage | SciPy mean coverage |
|---|---|---|
| Percentile | 93.87% | 93.67% |
| Basic | 93.07% | 93.13% |
| BCa | 93.60% | 93.40% |
The mean absolute matched difference was 0.42 percentage points and the largest difference was 1.67 points. Cluster coverage, measured only for bootstrapx, was 93.67% for percentile, 93.00% for basic, and 93.33% for BCa. This supports implementation agreement, not a universal 95% guarantee.
The difficult cells are important context: basic intervals for the exponential median covered 91.67%, while Bernoulli conversion and paired normal cells were near 92–93%. SciPy showed similar undercoverage in the matched cells. Bootstrap coverage depends on the statistic, distribution, sample size, and interval method; inspect the Wilson bounds in the CSV instead of treating the nominal level as a promise.
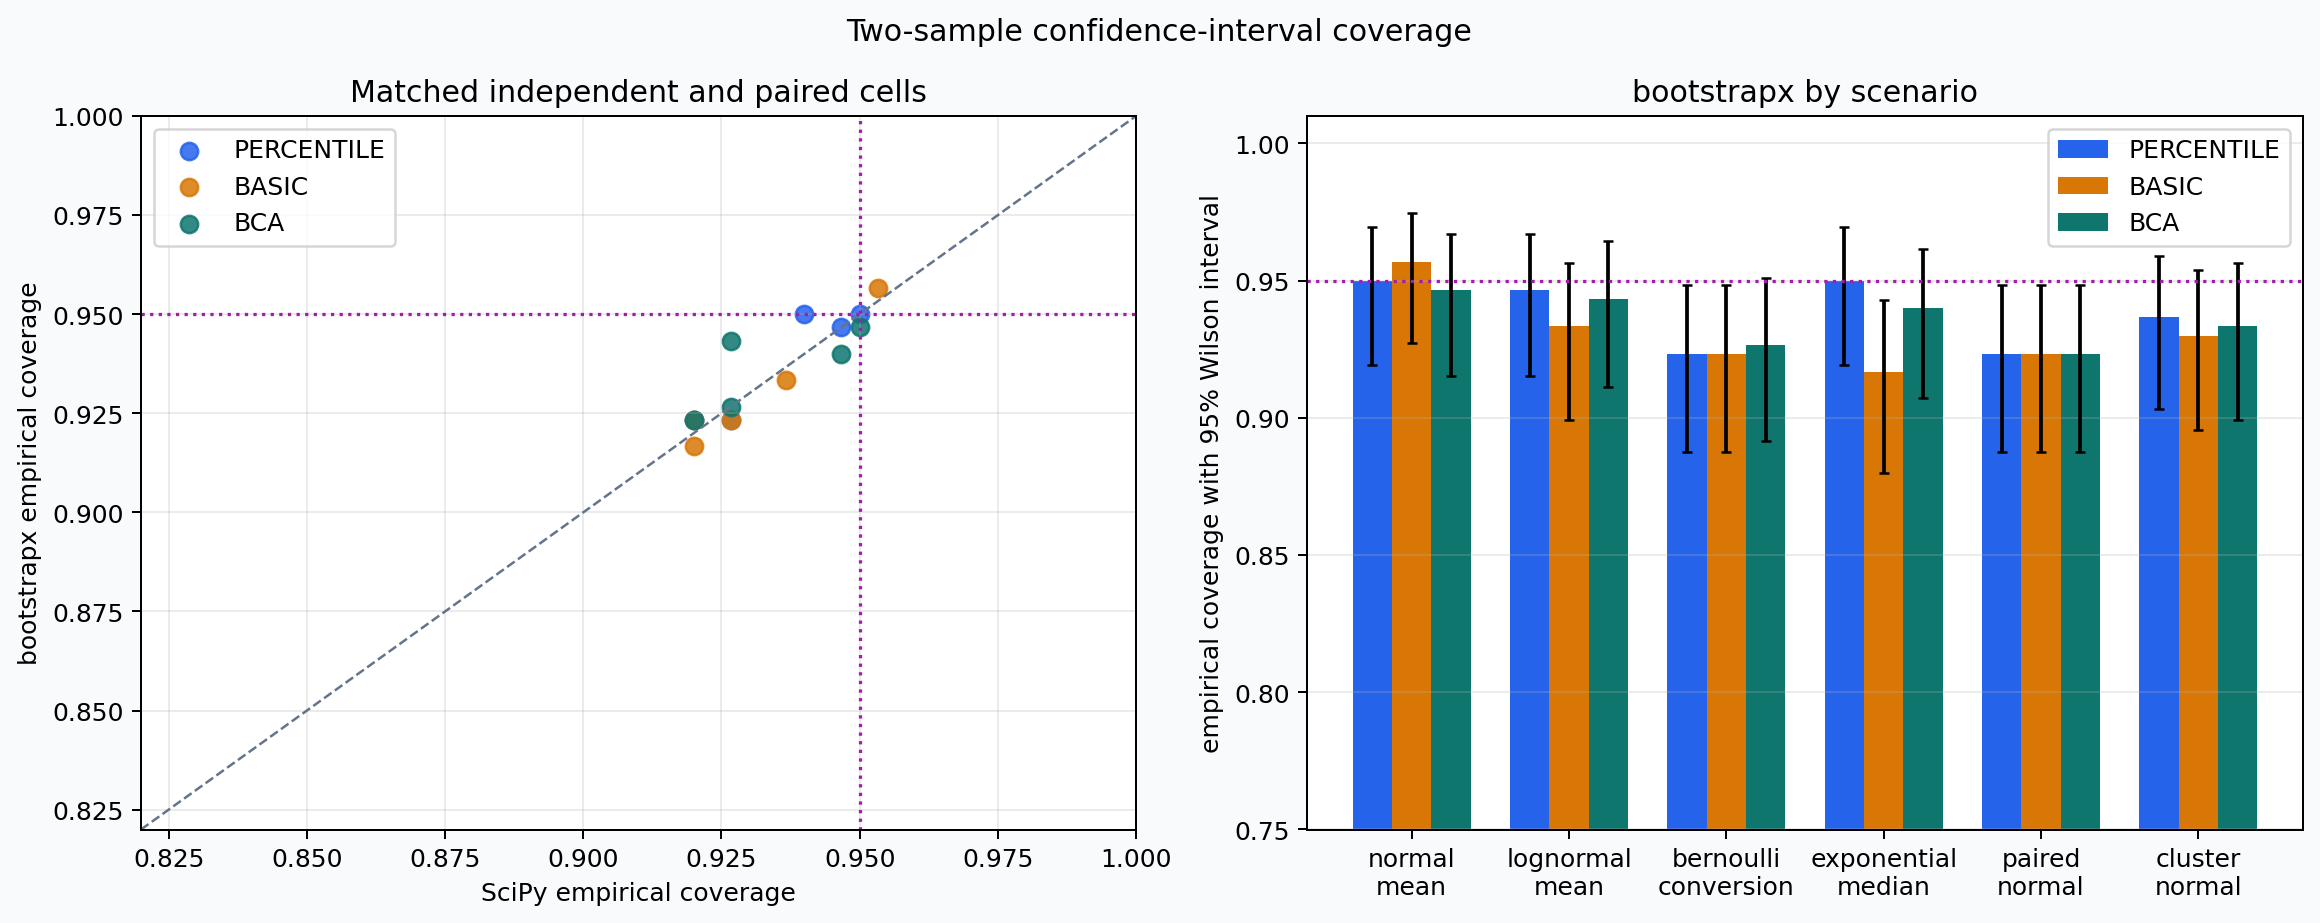
Auditable inputs: coverage CSV and environment metadata.
Audited 0.5.0 runtime and allocation evidence
Each timing cell used 4,999 resamples, one unmeasured warm-up, and the median
of five measured calls. The statistic was np.mean and the effect was a
treatment-minus-control difference. This recorded run compared bootstrapx
with both SciPy's scalar vectorized=False configuration and SciPy's
vectorized path using the same bounded-batch heuristic as bootstrapx. Values
above 1 in either ratio column mean bootstrapx was faster; values below 1 mean
the corresponding SciPy configuration was faster.
| Method | Control / treatment rows | bootstrapx (ms) | SciPy scalar (ms) | SciPy bounded-vectorized (ms) | Scalar / bootstrapx | Vectorized / bootstrapx |
|---|---|---|---|---|---|---|
| Percentile | 200 / 250 | 37.74 | 48.34 | 17.93 | 1.28× | 0.48× |
| BCa | 200 / 250 | 40.48 | 51.00 | 19.14 | 1.26× | 0.47× |
| Percentile | 1,000 / 1,250 | 77.94 | 152.21 | 121.74 | 1.95× | 1.56× |
| BCa | 1,000 / 1,250 | 86.74 | 179.34 | 159.84 | 2.07× | 1.84× |
| Percentile | 10,000 / 12,500 | 535.89 | 1,392.56 | 1,201.87 | 2.60× | 2.24× |
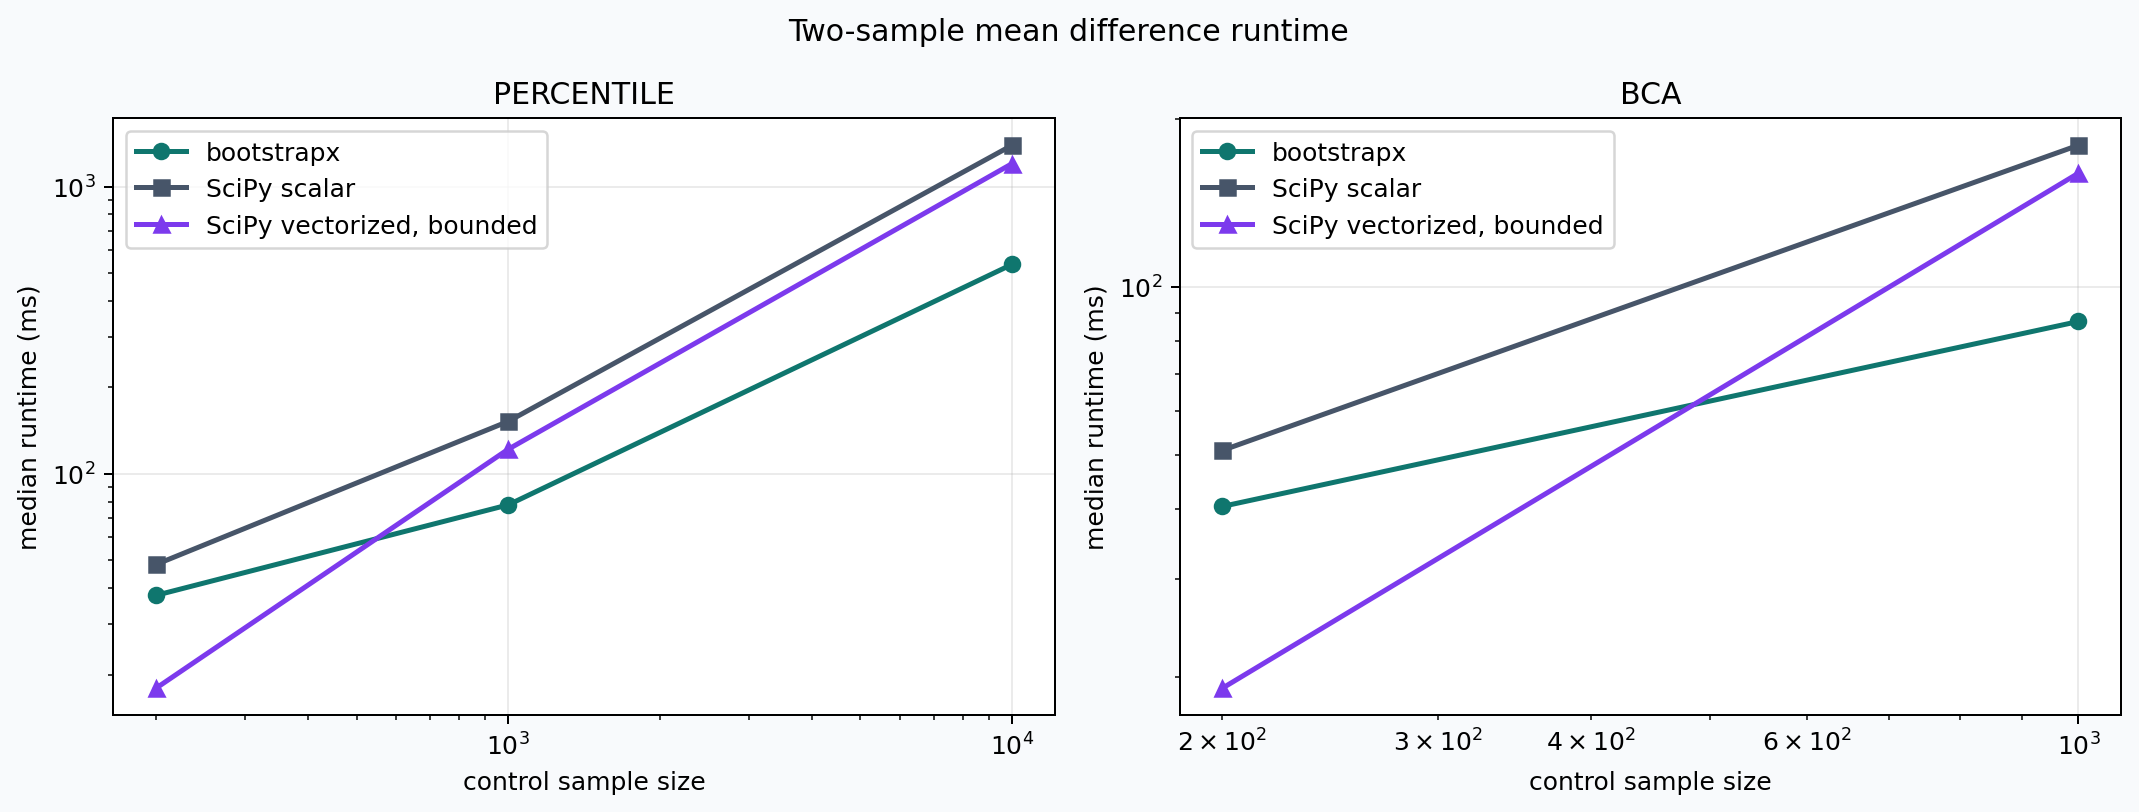
The tracemalloc peaks for bootstrapx, scalar SciPy, and bounded-vectorized
SciPy were respectively 0.137 MB, 85.867 MB, and 0.222 MB at 500 control rows;
at 2,000 rows they were 0.097 MB, 343.308 MB, and 0.805 MB. The scalar SciPy
path used its default batch, while the vectorized path used the matched bounded
batch. These figures demonstrate only the recorded configurations, not a
unique or universal bootstrapx memory advantage. tracemalloc is not process
RSS and does not cover every native allocation, so the result must not be
presented as total-memory usage. Cluster-only bootstrapx calls took 120.38 ms
for 40 control clusters and 439.09 ms for 200 clusters, with five rows per
cluster.
Auditable inputs: runtime CSV, memory CSV, cluster runtime CSV, and environment metadata.
Audited 0.4.4 release runtime
Measured from the versioned 0.4.4 release run on Apple Silicon/macOS 15.7.4,
Python 3.11.5, NumPy 2.4.6, and SciPy 1.17.1. Each cell uses np.mean, 4,999
resamples, a fixed seed, one unmeasured warm-up, and the median of five calls.
| Method | n | bootstrapx (ms) | SciPy (ms) | SciPy / bootstrapx |
|---|---|---|---|---|
| BCa | 200 | 4.93 | 9.47 | 1.92× |
| BCa | 500 | 11.43 | 15.09 | 1.32× |
| BCa | 1,000 | 30.11 | 30.54 | 1.01× |
| BCa | 2,000 | 51.18 | 66.12 | 1.29× |
| Percentile | 1,000 | 29.06 | 27.27 | 0.94× |
| Percentile | 5,000 | 116.00 | 337.72 | 2.91× |
| Percentile | 10,000 | 200.18 | 676.19 | 3.38× |
A ratio above 1 means bootstrapx was faster in that cell. The crossover is real: the benchmark does not support a blanket “bootstrapx is faster” claim. Runtime also depends on dependency versions, CPU, statistic, batch size, and sample shape.
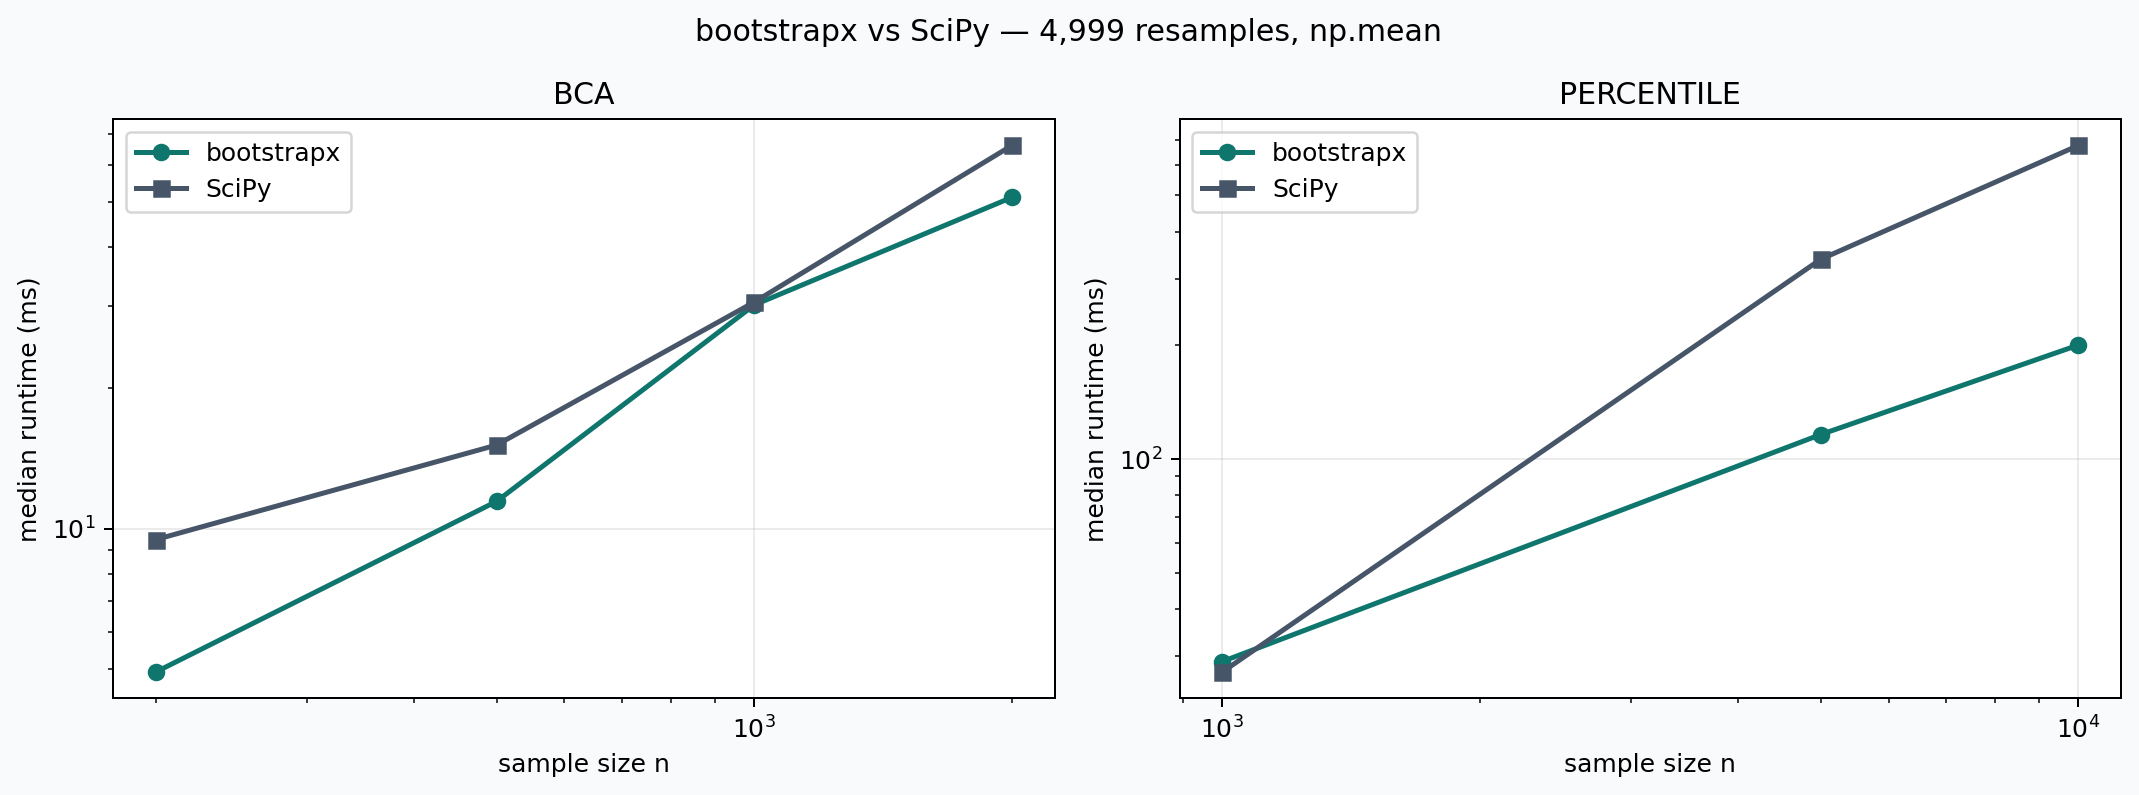
Auditable inputs: speed CSV and environment metadata.
Arbitrary-callable results were similarly mixed. For n=1,000, trimmed mean
took 566.89 ms versus SciPy's 602.13 ms, while IQR took 1,138.10 ms versus
1,170.37 ms. These numbers do not predict the cost of another callable.
Memory measurement
The release benchmark's tracemalloc peak for BCa was 0.224 MB versus 38.149
MB at n=500, and 0.340 MB versus 152.567 MB at n=2,000. This supports the
narrow claim that batching greatly reduced allocations visible to
tracemalloc in this configuration.
Auditable input: memory CSV.
It is not a process-RSS or native-allocator guarantee. bootstrapx retains the
bootstrap distribution and method-specific arrays, so total memory is not
constant. A future release benchmark should add peak RSS alongside
tracemalloc before stronger memory claims are made.
Optional Numba acceleration
pip install -e ".[numba]"
python benchmarks/bench_numba.py
This compares the same public bootstrap workflow against bootstrapx's Python
fallback. It reports first-process-call latency separately from warm runtime.
Only MBB, CBB, stationary, and the block-index portion of tapered bootstrap use
Numba. See When Numba helps.
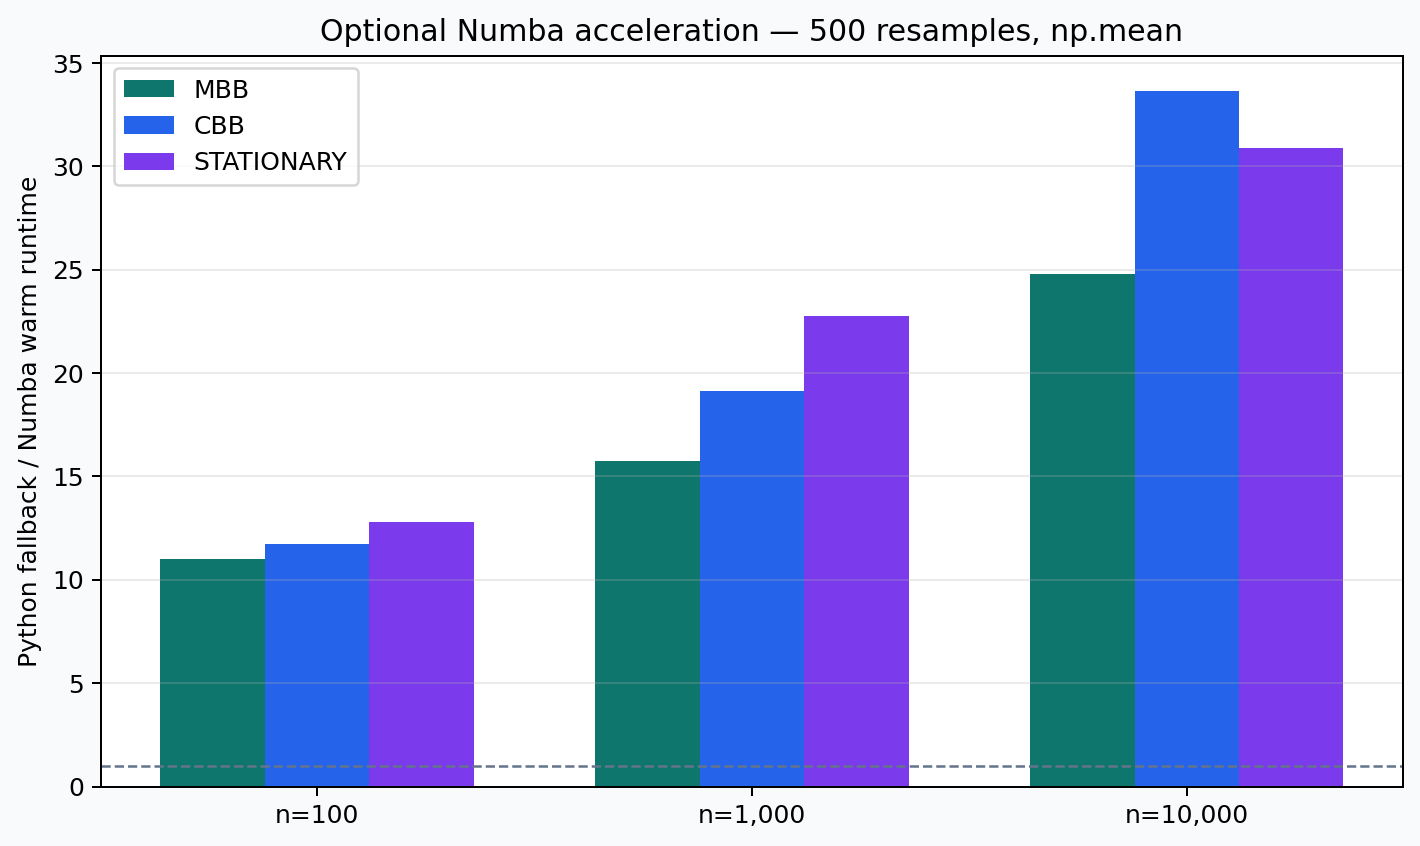
In this release run, warm end-to-end np.mean calls with 500 resamples were
11–34× faster with Numba for MBB, CBB, and stationary bootstrap across
n=100–10,000. The first process call ranged from 0.007 to 0.121 seconds;
it is a local startup measurement, not a latency guarantee.
Statistical coverage
The release study completed all 160 planned matched cells: BCa and percentile
intervals; mean, median, and standard deviation; n=200, 500, 1,000, and
2,000; and the distributions defined by the benchmark. Every cell used 300
independently generated datasets, 4,999 resamples, and independent deterministic
streams for data generation and resampling. No trial failed or produced an
invalid interval.
Mean empirical coverage was 94.23% for bootstrapx BCa, 94.26% for bootstrapx
percentile, 94.17% for SciPy BCa, and 94.26% for SciPy percentile. The largest
matched bootstrapx/SciPy difference was 0.67 percentage points. This is useful
agreement evidence, but not a universal accuracy certificate: with 300 trials,
a single cell's 95% Wilson interval is roughly six percentage points wide. Both
libraries, for example, covered the standard deviation of exponential data at
n=200 only 90.33% (BCa) and 90.67% (percentile) of the time.
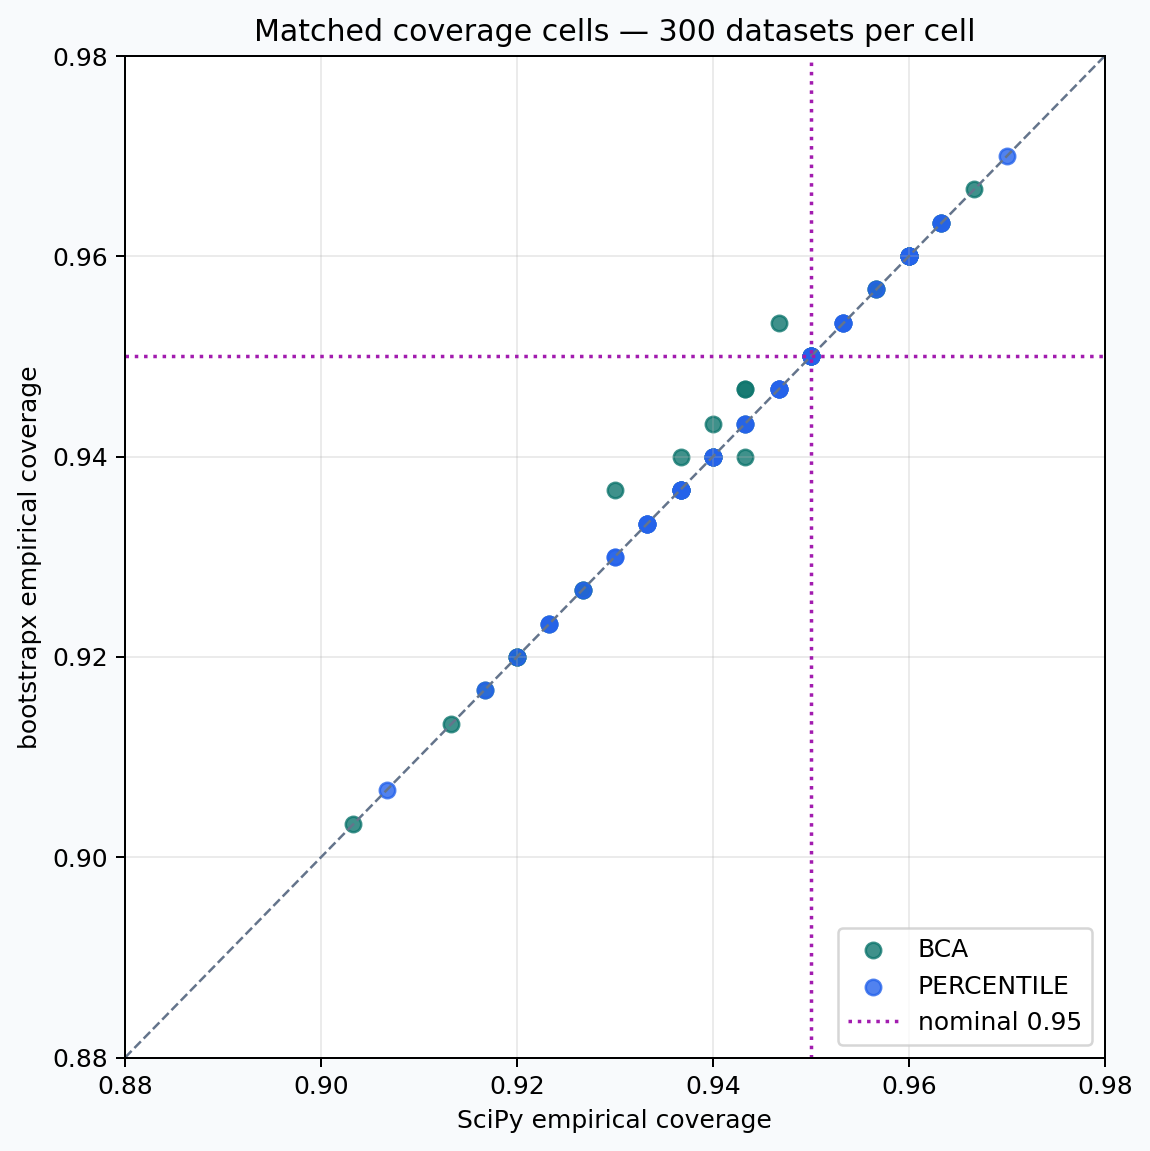
The coverage CSV includes coverage, Wilson bounds, failures, and invalid trials for every cell; the metadata records the exact commit and environment. It is more informative to inspect the cells matching your statistic and data distribution than to rely on the overall mean.
Reproduce the speed subset
python benchmarks/bench_speed.py --quick
When publishing a new result, record CPU, OS, Python, NumPy, SciPy and Numba
versions, commit hash, n, n_resamples, statistic, method, block setting,
warm-up policy, repeat count, and memory measurement tool.
Run the 0.4.4 release suite
Create a clean environment from the release-candidate branch:
python3 -m venv .venv-bench
source .venv-bench/bin/activate
python -m pip install --upgrade pip
python -m pip install -e ".[dev,numba]"
Start with the quick profile. It verifies every benchmark pipeline and produces real speed/Numba measurements, but its two-simulation coverage result is only a smoke test:
python benchmarks/run_release.py \
  --profile quick \
  --output-dir benchmark_runs/v0.4.4-quick
Then run the release profile. It uses 300 datasets per coverage cell; this run took about 39 minutes on the M1 machine above, and may take longer elsewhere:
python benchmarks/run_release.py \
  --profile release \
  --output-dir benchmark_runs/v0.4.4-release
If the process is interrupted, run the identical command with --resume:
python benchmarks/run_release.py \
  --profile release \
  --output-dir benchmark_runs/v0.4.4-release \
  --resume
For tighter statistical estimates, use 1,000 simulations per cell. Expect it to take several times longer than the release profile rather than treating it as a normal CI job:
python benchmarks/run_release.py \
  --profile statistical \
  --output-dir benchmark_runs/v0.4.4-statistical
An optional 2,000-simulation coverage run is available separately:
python benchmarks/bench_coverage_accuracy.py \
  --full \
  --output-dir benchmark_runs/v0.4.4-coverage-full
All profiles preserve previous runs, record the exact environment and commit,
and checkpoint coverage after each configuration. Avoid other CPU-heavy work
during runtime measurements and keep the Mac connected to power. After the run,
share the chosen benchmark_runs/v0.4.4-* directory; README tables and plots
should be generated only from that directory.